
Description
React Data Visualization – Build a Cryptocurrency Dashboard 2020-10 is a Udemy course taught by react.school _. Language: English; Duration: 3 hours and 45 minutes.
React Data Visualization – Build a Cryptocurrency Dashboard 2020-10 is a course from Udemy. Review the listed course specifications, preview and available download editions on this page before choosing a resource.
What you will learn
- The material covers React and management.
- The material covers React.
Course specifications
- Publisher
- Udemy
- Instructors
- react.school _
- Language
- English
- Level
- All Levels
- Duration
- 3 hours and 45 minutes
- Subtitle
- English
- Quality
- 720p
- Edition
- 2020-10
Course topics
View course topics
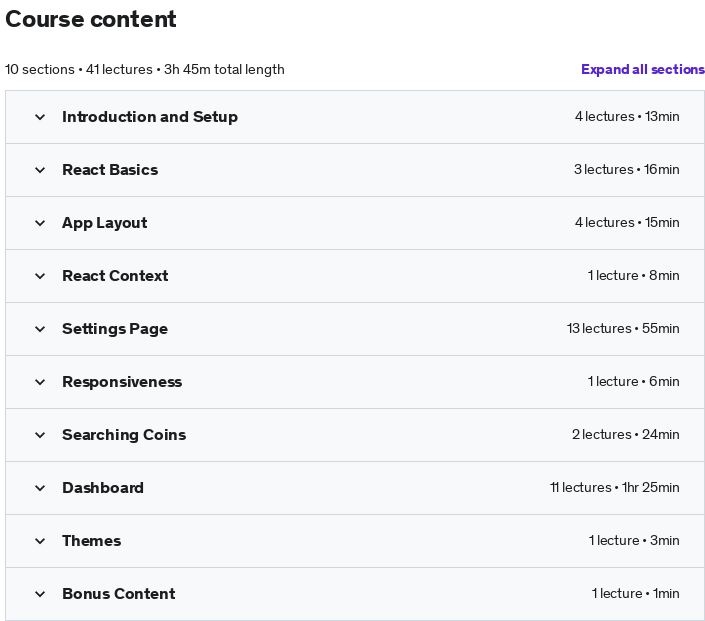
The course topics image is temporarily unavailable.
Prerequisites
- Prerequisite topics include React.
Pictures
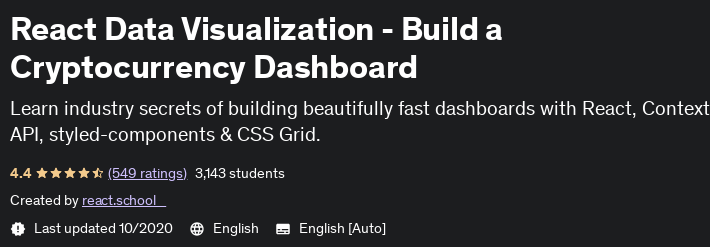
This picture is temporarily unavailable.
Introduction video
How to open the files
Extract the files and play the included course media with a compatible player.
Download resources
Choose one edition and keep its parts together. Alternate providers are available when listed.
2020-10 · 720p
Direct downloads
2020-10 · 720p
Archive password
Size
2.2 GB
Leave a Reply
Signed-in member comments appear immediately.