
Description
Use Looker Studio, described in the source under its earlier Data Studio name, to turn Google Sheets data into interactive reports. The lessons introduce the reporting interface and common chart types before adding scorecards, filters and time-based comparisons.
The practical focus is on building dashboards that expose useful metrics and let readers explore the data. Examples include period-to-date calculations, comparisons with earlier periods and time-series views. The course also covers sharing and collaboration, making it relevant to spreadsheet users who want to present results beyond a worksheet.
What you will learn
- Create dashboards from Google Sheets data.
- Build scorecards, charts, filters and period comparisons.
- Share reports and collaborate on dashboard content.
Course specifications
- Publisher
- Udemy
- Instructors
- Ian Littlejohn
- Language
- English
- Level
- All Levels
- Duration
- 5 hours and 30 minutes
- Lecture count
- 77
- Subtitle
- English
- Quality
- 720p
- Edition
- 2026-9
Course topics
View course topics
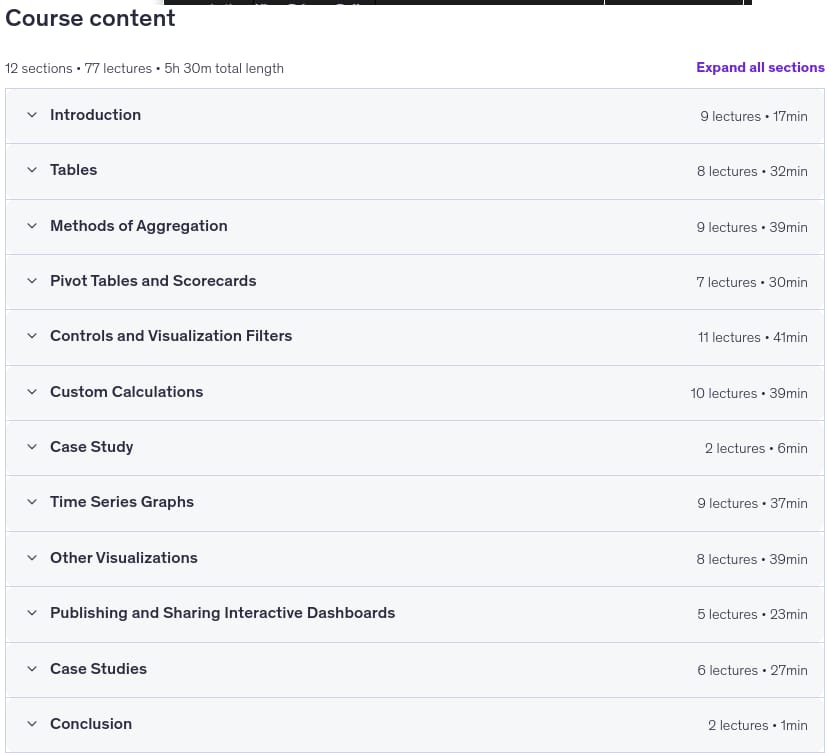
The course topics image is temporarily unavailable.
Prerequisites
- A Google account.
- Access to Google Sheets and Looker Studio/Data Studio.
Pictures
This picture is temporarily unavailable.
Introduction video
How to open the files
Keep all parts of the same edition together before extracting the first archive. Open the included course media with a compatible player.
Download resources
Choose one edition and keep its parts together. Alternate providers are available when listed.
2026-9 · 720p
Direct downloads
2026-9 · 720p
Size
2.07 GB
Leave a Reply
Signed-in member comments appear immediately.